About this project
OrbitalMap shows what is in orbit around the Earth right now. The catalogue of tracked objects - working satellites, spent rocket stages and debris - is published as orbital elements by Space-Track (18 SDS/USSPACECOM), and every position is worked out in your own browser, which is why the map keeps moving after the connection drops.
Around the satellites it carries the ground they left: active and retired spaceports, the launches already flown and the ones still scheduled, the weather over the pad in the hours around a window, fireballs caught by sensors on the way down, and the news that follows all of it.
Filter that catalogue by purpose, operator, orbit class or how long an object has left; wind the clock forward and back; ask what will cross your own sky tonight and whether it will be bright enough to see; and follow the craft still flying between the planets and beyond them. Every term on the map has an entry in its handbook.
Open the mapWhat it looks like
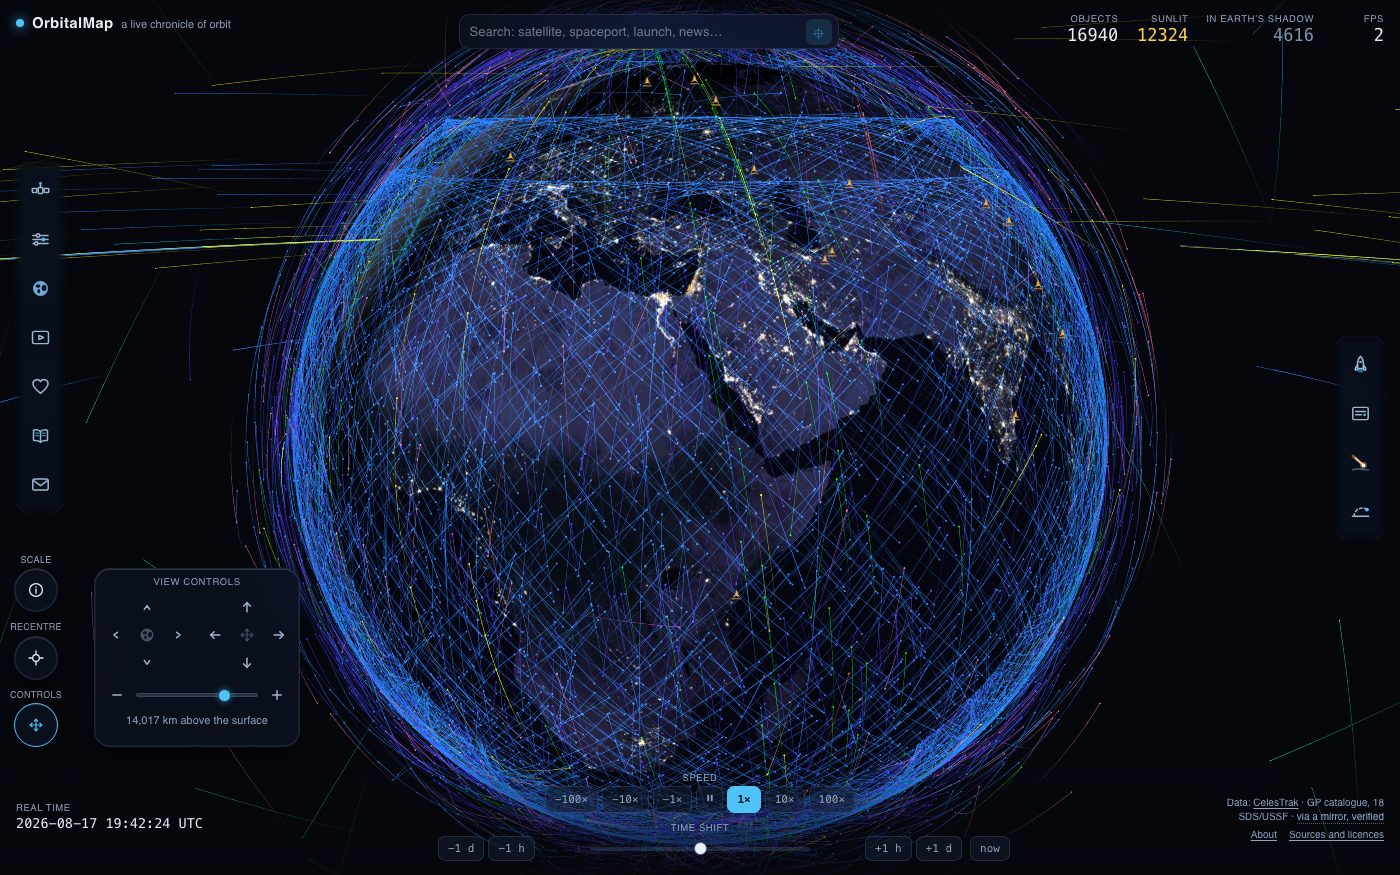
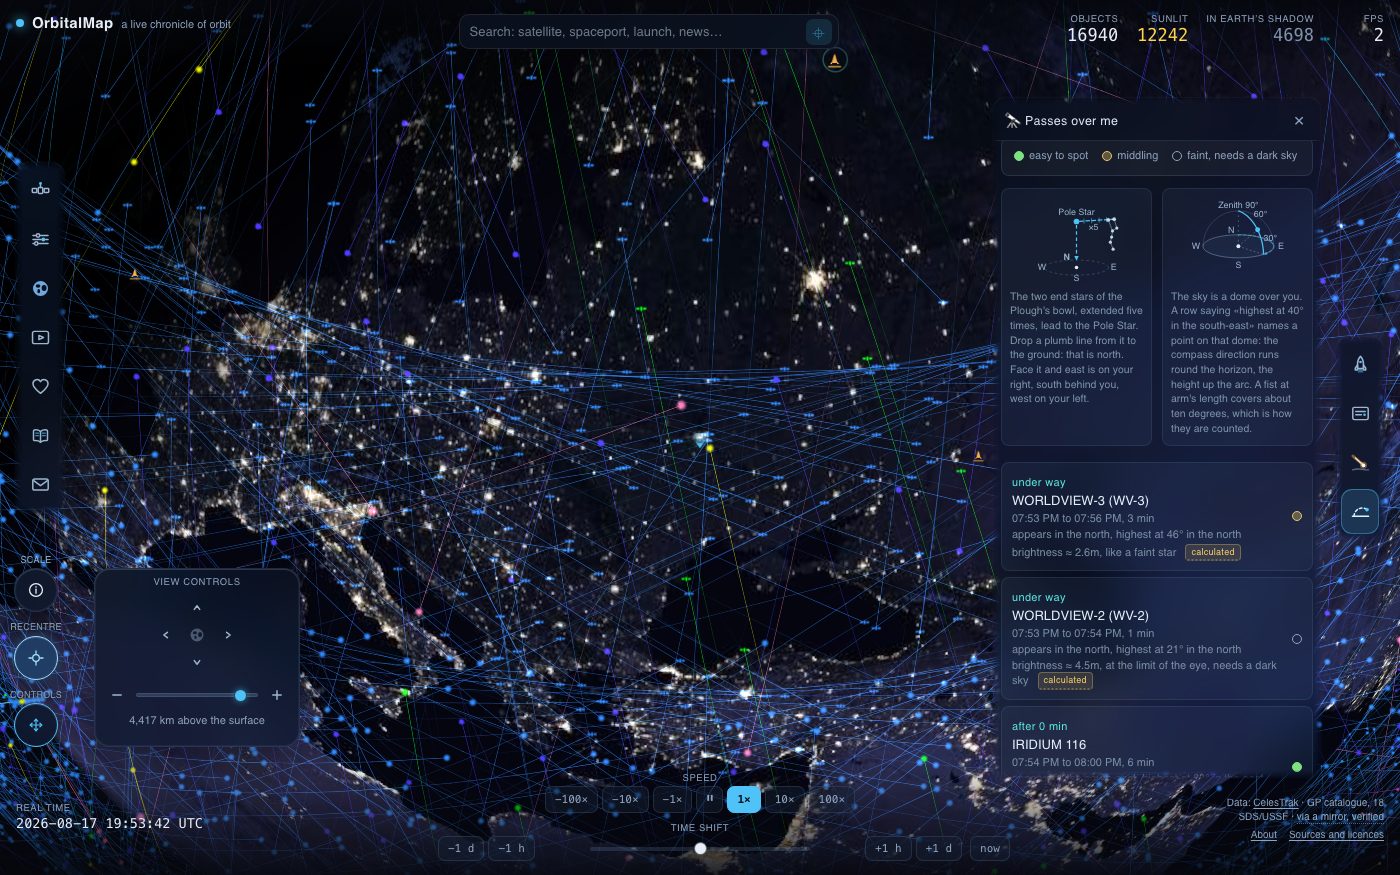
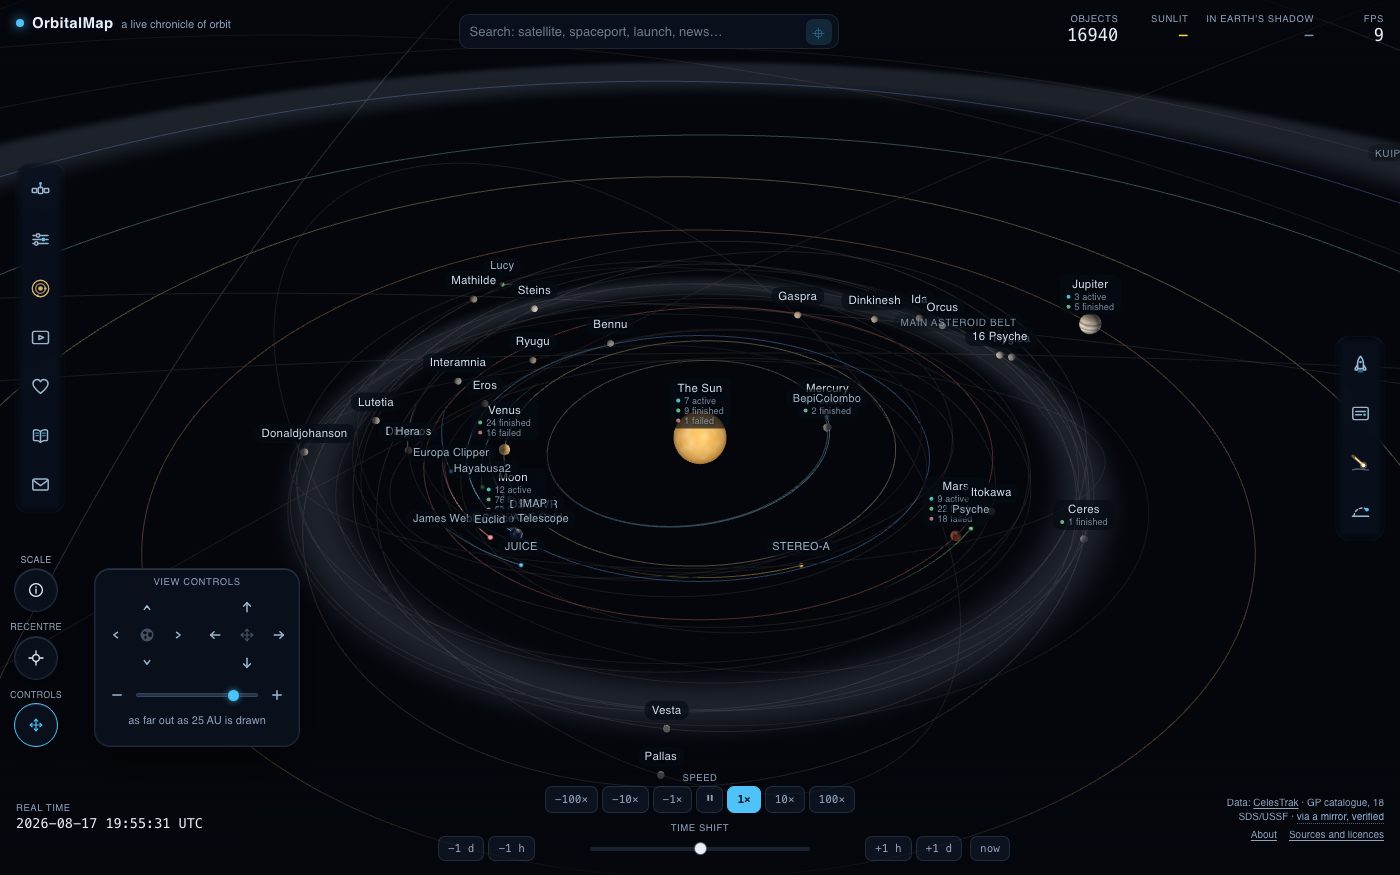
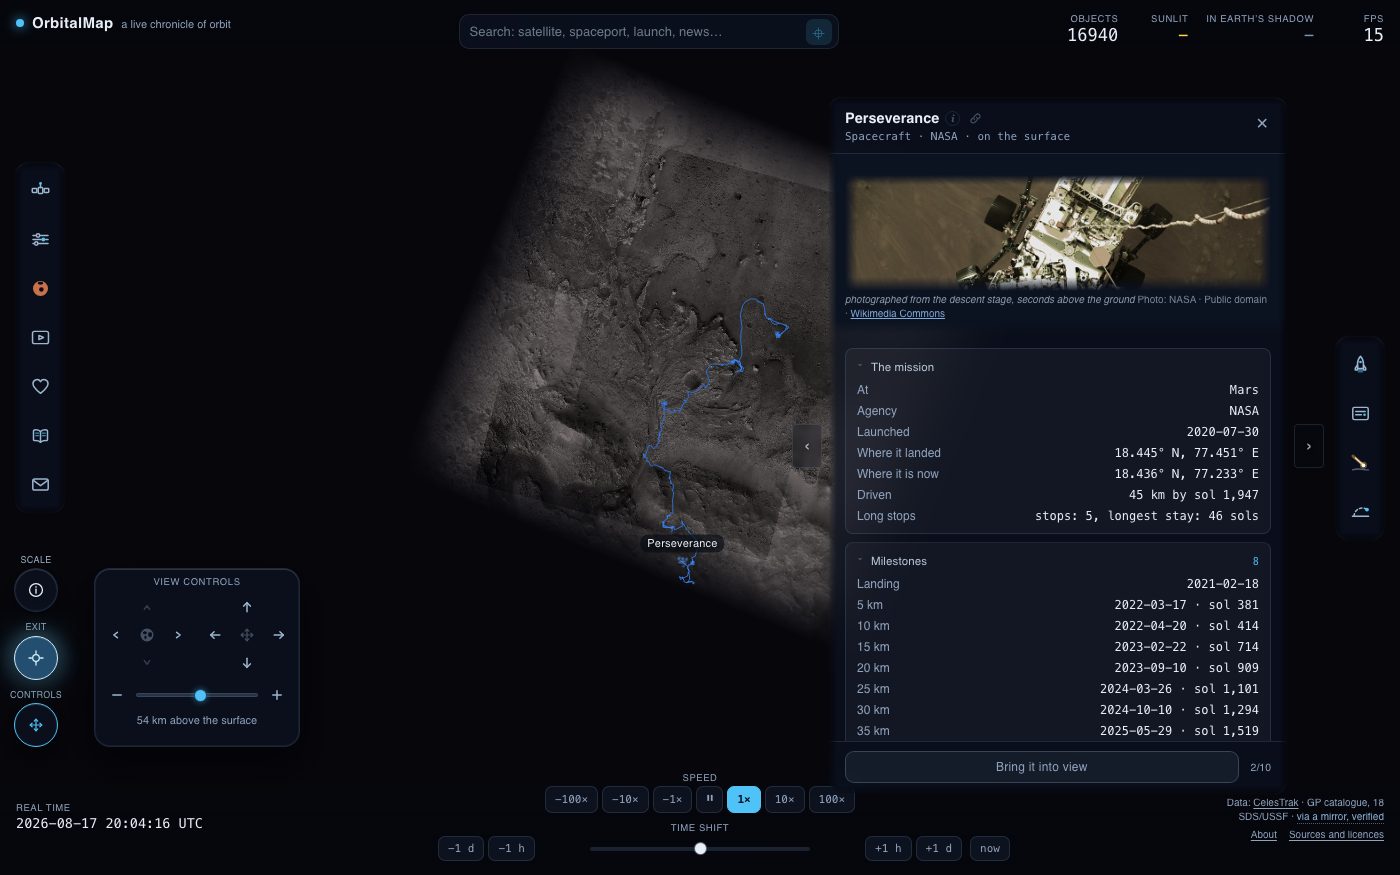
Two of these are things a satellite tracker does not do. The sky over your own address is drawn as a dome you stand under, with the objects where they actually are above you rather than on a flat chart; hold a phone up and it turns with the compass. And the same dome can be raised anywhere on another world; on Mars and the Moon it stands on their measured ground, under the orbiters due to pass over it.
Where the numbers come from
A figure that was measured is credited to whoever measured it; a figure we worked out ourselves - altitude, speed, the time an object next passes over you - says so where it is shown. Every source is public, and all of them are listed under Sources and licences.
Each source keeps its own licence rather than this project's, and no two are quite alike: some are public domain, some ask for attribution, and a couple state no terms at all, in which case they are read rather than republished. The list is summarised for automated readers at /llms.txt.
How it is paid for
The map is free to use, shows no advertising and sets no cookies of its own; it is paid for by donations. Page views are counted by Cloudflare, which is told the page and how fast it loaded and nothing that identifies the reader. It reads in every language listed at the top of Settings.
How it is built
A static site in vanilla TypeScript, with Three.js drawing the globe, the sky and the Solar System, and satellite.js propagating the orbits. There is no framework and no application server: the pages for the individual objects and for each language are written out at build time, so a reader arriving from a search result finds the answer in the file rather than after the scripts have run.